Conceptual Model
A strong Low–level Convergence signature below a storms updraft can be used as one of many signatures that suggests that the associated updraft is likely to intensity or is already strong. The reason for this interpretation is that convergence below an updraft naturally enhances the low–level mass flux into the updraft, supplying it with water vapour and energy.
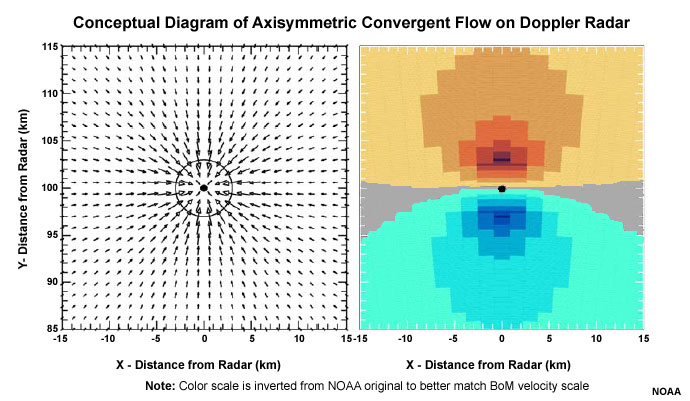
Doppler velocity pattern (right) corresponding to axisymmetric convergent flow (left). The maximum radial velocity of 25 m s-1 (49 kt) is at a core radius of 3 km (1.6 n mi); the radius of maximum winds is indicated by the circle. Black dot represents the center of the flow. Arrow length is proportional to wind speed. Negative (positive) Doppler velocities represent flow toward(away from) the radar.
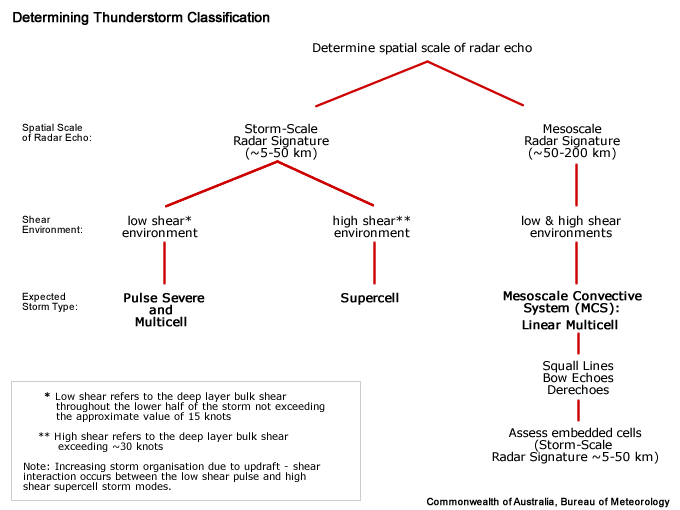
Determining Thunderstorm Classification
Low–level Convergence signatures could be found associated with all storm types listed here.
To help determine the classification of the thunderstorm you are observing, use the following flow chart to help diagnose which thunderstorm conceptual model you should consider more closely