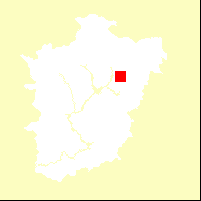
 The figure to the right shows the location of the first application.
The second experiment consisted of restricting surface application of nitrogen to small (300 m by 300 m) areas at different locations in the watershed. The resulting concentration time series may be used to help identify nitrogen sources within the watershed.
The figure to the right shows the location of the first application.
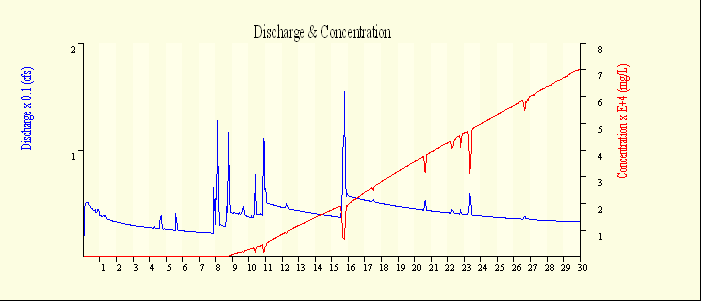
The resulting stream flow nitrogen concentration time series is shown in the figure above. Note that the initial trace of nitrogen shows up in the stream late in day 8. The maximum concentration is 0.0007 $\frac{\mbox{mg}}{\mbox{L}}$.
[ Animation of the nitrogen flow in the saturated zone.]
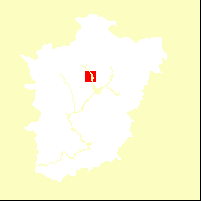 The second location for nitrogen application is shown in the figure to the right.
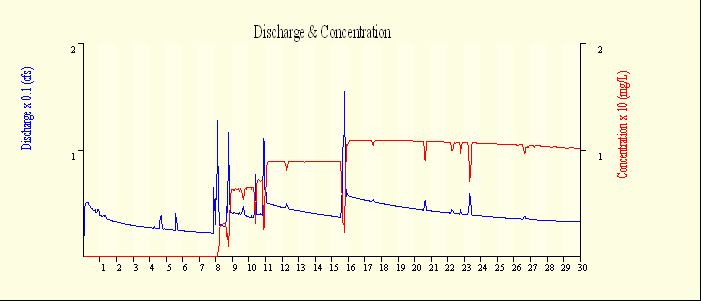
The resulting stream flow nitrogen concentration time series is shown in the figure above. Note that the initial trace of nitrogen shows up in the stream early in day 8. The maximum concentration slightly more than 0.1 $\frac{\mbox{mg}}{\mbox{L}}$.