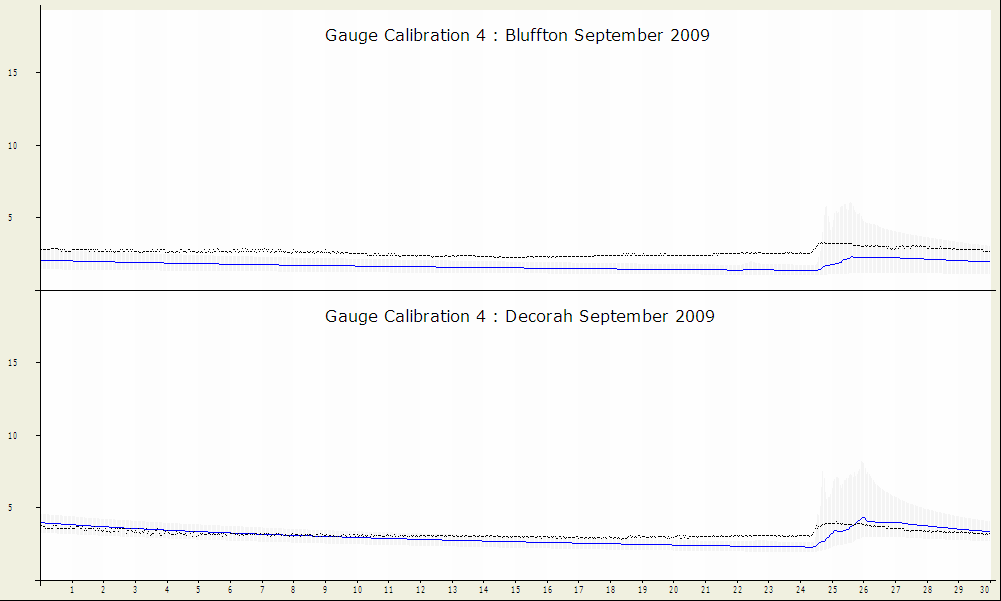

The figure above shows the observed hydrograph for Decorah plotted in black. The blue hydrograph represents the median flow calculated using the generalized likelihood uncertainty estimation (GLUE) method. The 90% confidence interval, derived from the GLUE method, is shown in grey.