4.4.1 Forecasting the Onset of Damaging Winds
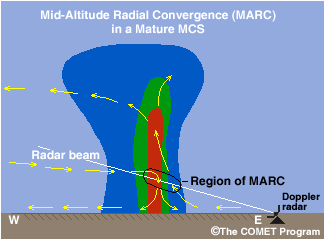
Given a Doppler radar in the proper viewing position relative to a bow echo
or LEWP (line echo wave pattern) in a squall line, it is sometimes possible
to predict the onset of damaging surface winds using another radar pattern
know as the MARC signature. Coined by Schmocker and coauthors in 1996, MARC
stands for mid-altitude radial convergence and is detectable in Doppler velocity.
It is best viewed when the bowing segment is perpendicular to the radar beam.
4.4.2 The MARC Technique
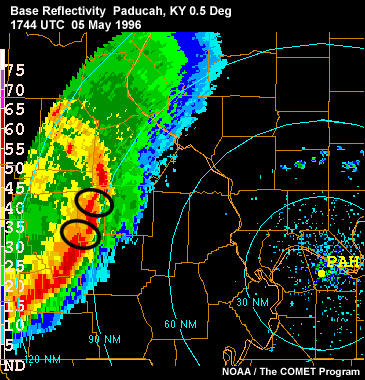
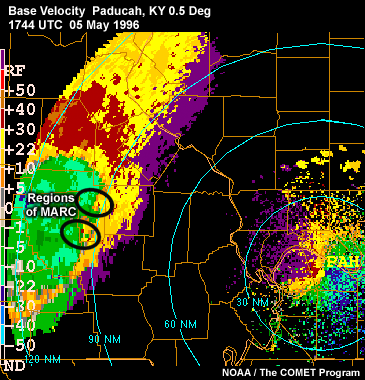
Case studies like this one have shown a good correlation between values of
MARC velocity differentials of at least 25 to 30 m/s (50 kt or greater) and
successive damaging surface wind gusts. The small regions of strong outbound
velocities (warm colors maximizing in red) signify a component of the system's
updraft current (when viewing a storm approaching from the west). The small
regions of strong inbound velocities in each oval (cool colors up to light
green) depict the storm's convective-scale downdrafts and origins of the mesoscale
rear-inflow jet.
Summary of MARC Characteristics:
| Horizontal Extent |
One to three locally enhanced convergent areas (velocity differentials)
are found embedded within a larger region of convergence extending
from 60 to 120 km (32 to 65 n mi) in length |
| Depth |
Average of 6.2 km (from 3 to 9 km or 9,800 to 29,500 ft in height),
with the maximum convergence found in the midlevels of the storm (5 to
5.5 km or 16.5 to18 kft in height) |
| Width |
2 to 6 km (1 to 3 n mi) |
| Magnitude |
Typical velocity differences of 25 to 50 m/s (50 to 100 kt) |
(Note: these values apply to midlatitude systems and are not calibrated
to the tropics.)
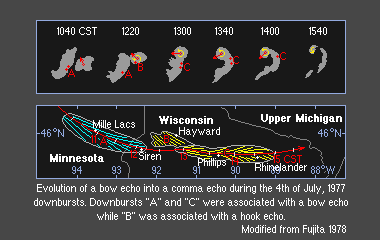
4.4.3 Supercell to Bow Echo Evolution
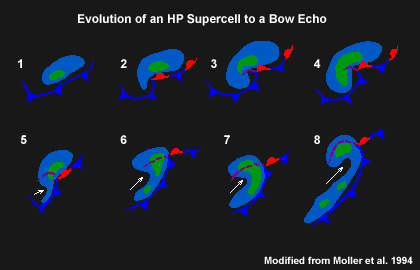
This figure shows the typical evolution of an isolated supercell to a bow
echo. Supercells are sometimes observed as part of the larger bow echo structure.
In some cases, an isolated supercell is observed to evolve directly into a
bow echo as the supercell decays. This evolution has been especially noted
with HP (heavy precipitation) supercells. Supercell to bow echo evolution is
especially common in the U.S. northern Plains.
4.4.4 Bow Echo Environments
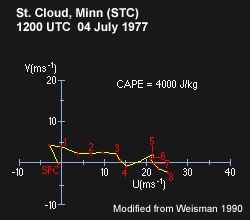
This buoyancy and shear
environment
produced
both bow echoes and a supercell. |
|
|
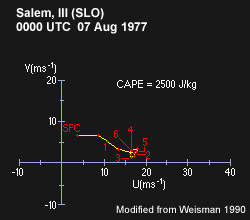
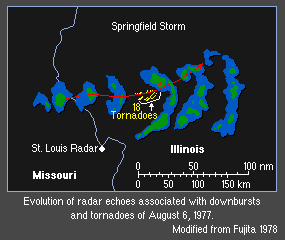
This
buoyancy and shear environment
produced only a strong bow echo. |
|
|
Numerous observational and modeling studies have shown that severe bow echoes
are most likely in moderate-to-strong low-level shear combined with very
high CAPE. Climatological studies show that the lifted index in a bow echo
environment averages about -8 (this usually indicates a CAPE value > 2500
J/kg), with average 700 hPa and 500 hPa winds of 17 m/s to 18 m/s (33 to
35 kt). Bow echo and supercell environments overlap a great deal. Bow echoes
are often observed evolving from supercells late in the supercell’s
life cycle. Because they occur in overlapping CAPE and shear environments,
there are numerous examples of bow echoes overtaking supercells, as in the
04 July 1977 case. Often both storms produce severe weather on their
own and then continue or even increase severe weather production including
strong tornadoes during and after their merger. Wolf provided detailed documentation
of such an event in a 1998 paper.
While there is overlap, some distinction between the two environments can
be made for forecasting purposes. Bow echoes are the preferred storm type
when the strong vertical shear is confined to the lowest 2 to 3 km AGL, and
supercells are favored when the vertical wind shear is strong and deep (extending
to at least 4-6 km AGL).
4.4.5 Bow Echo Motion

Click the image to view animation.
Like short squall lines, bow echoes tend to propagate in the direction of
the low-level mean vertical wind shear vector, at a speed controlled by the
speed of the cold pool. Since the cold pools in bow echoes are often exceptionally
strong, it is important to note that their propagation speed is often
much faster than nearby convective cells or systems. Notice how in
this case from 1992 the bowing MCS quickly overtakes all the leading convection,
including the supercells northwest of LSX.
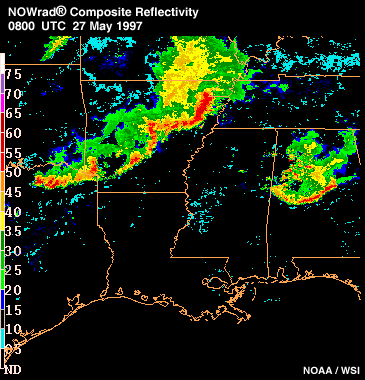
Bow echoes are observed both as relatively isolated convective systems and
as substructures within much larger convective systems. As mentioned before,
when multiple bow echoes develop within a squall line, the radar pattern
is often referred to as a line echo wave pattern or LEWP. If the cumulative
impact of the severe winds from these events covers a wide enough and long
enough path to meet the criteria, these multiple bow and/or especially long-lived
bow echo systems result in what is called a derecho.
4.4.6 What is a Derecho?
Long-lived convective systems that produce extensive and nearly continuous
straight-line wind damage are called derechos. Deh-RAY-cho is a Spanish word,
which can be interpreted as meaning “straight ahead." To be classified
as a derecho a single convective system must produce wind damage or gusts
greater than 26 m/s (50 kt) within a concentrated path area at least 400
km (215 n mi) long. The severe wind reports must exhibit a chronological
progression and there must be at least three reports of F1 damage and/or
convective wind gusts of 33 m/s (65 kt) or greater separated by at least
64 km (35 n mi). Additionally, no more than three hours can elapse between
successive wind damage or gust events. Operationally, forecasters often casually
refer to many wind-producing bow echo systems as derechos whether or not
it is known if they have or will meet this definition.
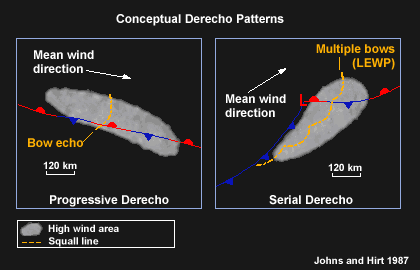
In their 1987 paper, Johns and Hirt classified derechos as one of two types, “progressive” or “serial.” Progressive
derechos are usually characterized by a single bow-shaped system that propagates
north of, but parallel to a weak east-west oriented stationary boundary. Serial
derechos are composed of a series of bow-echo features along a squall line,
usually located within the warm sector of a synoptic-scale cyclone.
4.4.7 Bow Echoes and Tornadoes
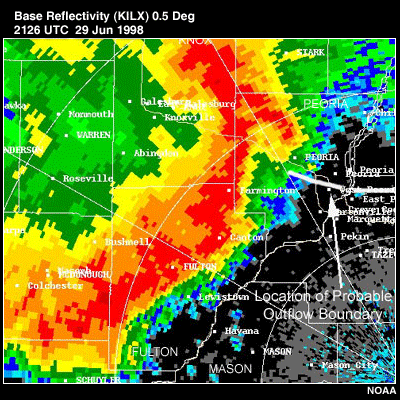
In the first few years of the 2000s, numerous observational and modeling studies
investigated the relationship between bow echoes/bowing line segments and tornadoes.
The high shear, very baroclinic zone at the leading edge of an MCS is a vorticity-rich
environment where stretching from the intense leading line convection can generate
numerous circulations, some of which become tornadic. The studies have consistently
shown that tornadoes are especially favored north of the apex of the bowed
region. Thus, in addition to the straight-line wind damage area with the bow,
this is an especially dangerous part of the bow. It is important to remember
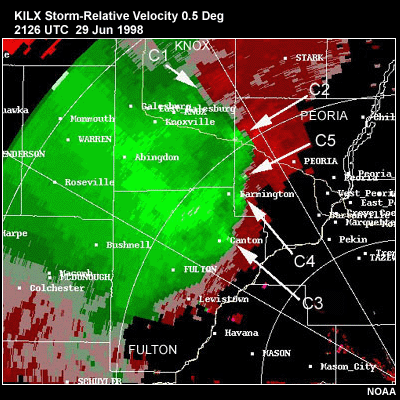
that as in the examples shown, many circulations may be observed in Doppler
velocity data, but only some if any of the circulations produce tornadoes.
In this case at this time, five circulations are identified, but only C2 and
C3 produced tornadoes, but not until after 2135 UTC
4.4.8 Forecasting Bow Echo Systems and Derechos
Weak Pattern Model:

Strongly-Forced Pattern Model:
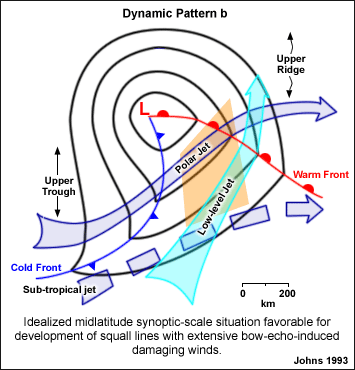
These two graphics from Johns 1993 depict two classic synoptic patterns
associated with long-lived bow echo systems and derechoes. At one end of
the spectrum are the warm season weakly forced systems that typically occur
with an east-west frontal boundary. At the other is the strongly forced setting
in advance of a midlatitude cyclone. The weak pattern is almost always associated
with high CAPE values, while the strongly forced pattern is accompanied by
varying CAPE regimes (largely depending on the season in which they occur).
Typical composite 500 and 700 hPa upper air charts associated with bow echo
systems have large dewpoint spreads indicative of a mid-level source region
of dry air. As mentioned before, dry air enhances evaporational cooling in
the system downdrafts, resulting in stronger outflows and potentially damaging
surface winds so commonly observed with bow echoes.
It is important to acknowledge that these two patterns represent the extremes
of the weather patterns potentially associated with bow echo severe wind-producing
patterns. Many bow echo systems occur with elements of both these patterns.
That is why we recommend focusing on buoyancy and shear combinations in addition
to using these classic patterns as alerts for possible widespread severe
weather and convective wind damage.
4.4.9 Anticipating Bow Echoes: Local Scale
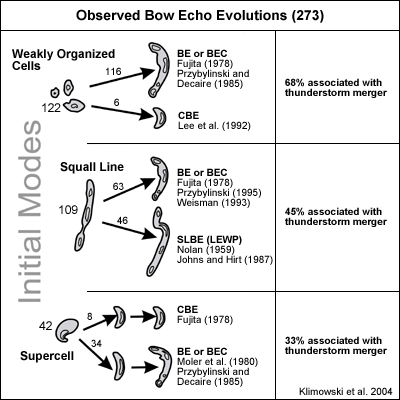
Recent research using radar observations of the early evolution of bow echoes
indicates that on the local scale monitoring radar data for some specific
scenarios can be especially helpful in anticipating bow echo formation. As
shown in this figure, cell evolution leading to bow echo formation fell into
three categories, 1) weakly organized cells, 2) squall lines, and 3) supercells.
The most common mode was for bow echoes to evolve from weakly organized cells.
The second most likely occurrence was for bows to form within a squall line.
It was this type, bow echoes within squall lines, that had the longest average
bow echo life span, that is, evolutions exceeding three hours. Finally, in
15% of the cases, the bow echo evolved from a supercell as described earlier.
This evolution mode leads to strong winds accompanied by very large hail.
Most notable, as shown on the right side of each category, is the tendency
for convective storms to “bow out” following storm mergers. Approximately
50% of all the bow echoes studied formed immediately following a radar-observed
merger of pre-existing storms! Also documented was the tendency for bow echoes
to form along and/or move parallel to surface boundaries. These two observations
are likely related because we know that storm motions vary in the vicinity
of mesoscale surface boundaries because the storms are evolving in different
vertical wind shear environments, and the differential storm motions promote
cell mergers.
As mentioned earlier in this module, bowed storm structures are an indicator
of strong winds already in progress. To forecast severe winds with bow
echoes you need to first know if your large-scale environment supports
bow echo formation (for example, in terms of the synoptic pattern, buoyancy,
and shear). Then, secondly in the monitoring phase, you can watch for
storm mergers and pay special attention to storms in the vicinity of
mesoscale boundaries.
4.4.10 Review Question: Forecasting Bow
Echoes
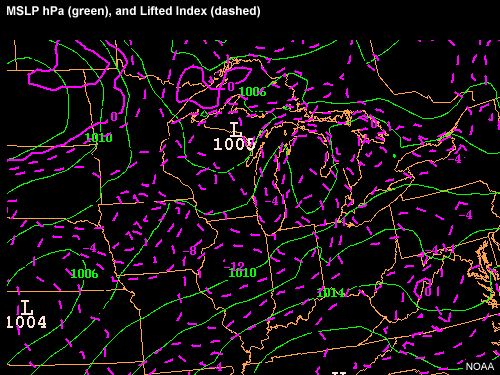
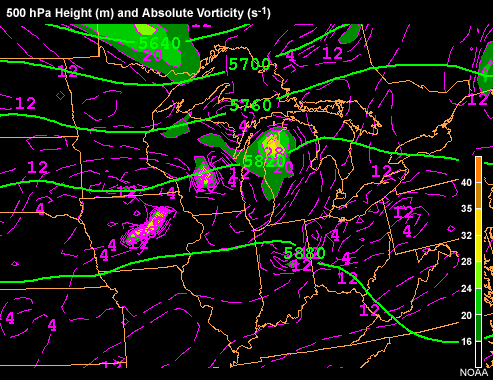
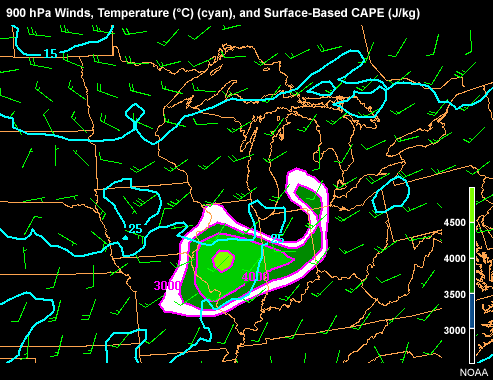
Consider the weather pattern on 4 July 2003. As shown on the 1200 UTC Eta
model six-hour forecast valid at 1800 UTC, there was a potentially unstable
air mass across the Great Lakes, the southern portion of the Upper Midwest,
the Central Plains, and the Ohio River Valley.
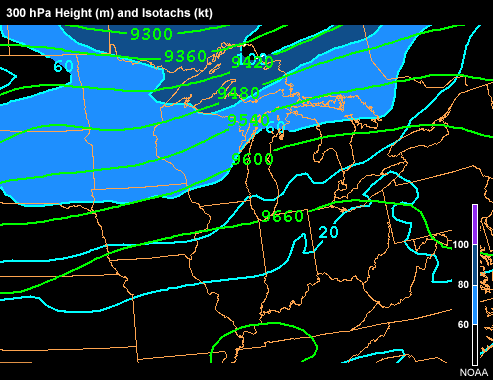
Examine the Eta model forecasts provided below. Note
the forecasted lifted indices of -8 to -10 from northeast Missouri to northern
Indiana and southwest Michigan. Satellite-derived CAPE (not shown) for this
area had reached 2000-3000 J/kg by 1800 UTC. The CAPE was forecast by several
models to exceed 5000 J/kg by early that evening.
When
you are ready, see if you can locate the
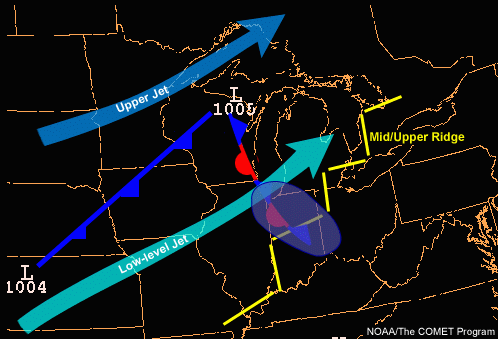
forecast upper jet, low-level jet, mid/upper ridge, and surface frontal positions
from the Eta model output. Draw these features on the MSLP chart provided,
then compare your prediction to the experts' and to what actually happened.
To complete the exercise you will be asked to answer a few questions based
on the data.
Review Question Feedback
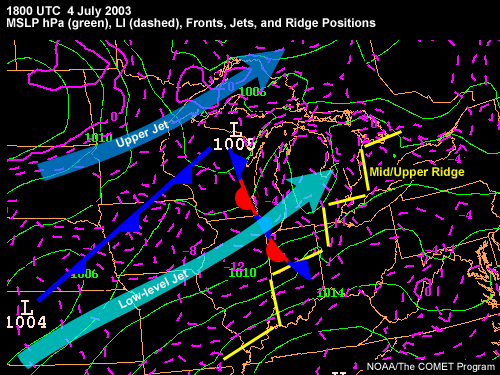
Compare your forecast features to the experts' in the image above. Please
answer the following questions based on the forecast map above.
1. Which of the conceptual models from Johns 1993 best fits this synoptic
pattern? (Refer to models below.)
a) Warm season pattern (weak pattern model)
b) Dynamic pattern b (strongly-forced pattern model)
c) Elements of both patterns
d) Elements of neither pattern
Weak Pattern Model:

Strongly-Forced Pattern Model:

2. What area is most likely to see the development of a bow echo during
the afternoon or evening of 04 July 2003?
a) Minnesota/Wisconsin
b) Indiana/Ohio
c) Iowa/Missouri
d) Michigan
e) None
Expert Analysis:
The correct response for question 1 is c) Elements of both patterns.
The correct answer for question 2 is b) Indiana/Ohio.
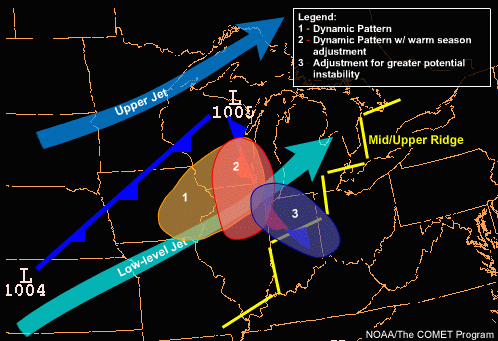
As illustrated in the above image, if this were Johns's dynamic pattern b,
a bow echo would be most likely in the warm sector between the upper and low-level
jets over Iowa and Wisconsin (Area 1). However, the dynamic pattern is a bit
off because this polar jet is well north of the surface features. These data
do not exactly fit the warm season pattern either, as the low-level jet is
nearly perpendicular to the stationary front rather than being parallel and
on top of it. The best approach for forecasting bow echo occurrence in this
case is to make a warm season pattern adjustment (Area 2) to the dynamic pattern
area and then adjust this area farther southeast (Area 3) toward the greater
potential instability. So, Indiana and southwest Ohio should have the greatest
chance for a bow echo.
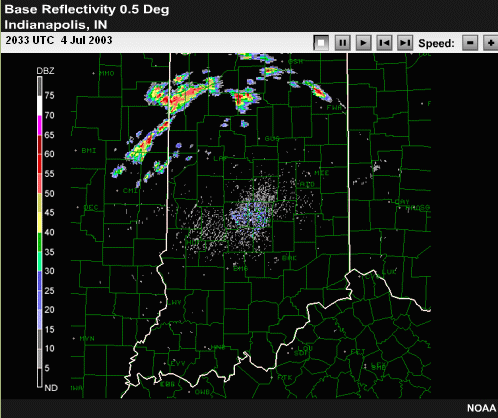
Convection eventually fired just south of Chicago on the leading edge of
the vorticity max. Extreme CAPE of 5000 to 6000 J/kg led to quick organization
of convection in Indiana into a well-formed MCS. A very strong bow echo formed
in this system and moved southeast through east-central Indiana into western
Ohio. Numerous reports of wind damage were received, including one fatality
in Indiana. The system weakened as it moved into southwestern Ohio and out
of the greatest potential instability.
Click the image above to view animation.
End of Section 4.3: Bow Echoes - Forecasting Hazards
End of Section 4 : Bow Echoes


