3.5.1 Squall Line Motion

For all types of squall lines, line motion is a result of both the advection
of individual cells within the line and propagation due to the triggering
of new cells. The overall propagation speed of the entire squall line tends
to be controlled by the speed of the system cold pool with new cells being
constantly triggered along its leading edge gust front. At midlatitudes where
some mid-level potentially negatively buoyant “dry” air is nearly
always available, an average cold pool speed is on the order of ~ 20 m/s
(40 kt). Nearly
everyone has experienced the cool, often refreshing and gusty winds that
accompany thunderstorm passage. However, with many organized systems these
winds become much stronger and potentially damaging as will be discussed
later.
3.5.2 Long Line Motion

Click the image above to view animation.
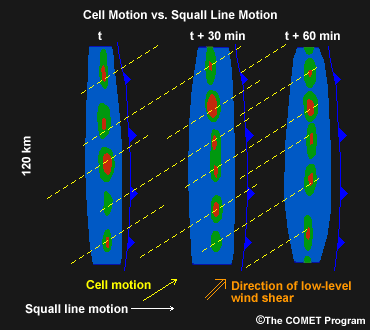
Within squall lines composed of primarily ordinary cells, each cell will
generally move with the 0-6 km mean wind with new cells triggering in the
downshear direction of the low-level vertical wind shear vector, along the
cold pool gust front. For very long squall lines (greater than 200 km or 110
n mi in length), individual cells may move at an angle to the line, but the
net motion of the line usually stays perpendicular to its initial orientation,
independent of the direction of the mean wind or mean wind shear vector. This
was true during the scenario case where the cells moved to the northwest,
but the long line overall moved eastward.
It may be difficult to assess cell motion within solid squall lines,
as shown in the radar reflectivity loop
above. Derived radar products, such as the
NEXRAD storm track indicator, 1-hour precipitation, or storm
total precipitation may help. Notice the southwest-to-northeast oriented
tracks in the STP product shown below for the same squall line that was animated
above.

3.5.3 Short Line Motion


Click the image above to view animation.
However, for shorter lines (where the heavy precipitation is less than about
100 km or 55 n mi long), the systems tend to reorient themselves over time
to be perpendicular to the mean low-level vertical wind shear vector. The
lines then propagate in the direction of the shear vector as new cells are
more easily triggered along the downshear gust front.
3.5.4 System Motion and Back Building
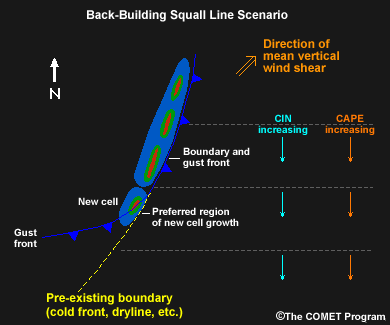
System motion can also be affected by variations in the environmental conditions
along the squall line. For instance, more cells may be triggered in regions
where the CAPE is greater or LFC is lower, thereby promoting squall line propagation
toward the region with more favorable environmental conditions. This image
shows a common scenario where cells are first initiated to the north where
the “cap” or convective inhibition (CIN) is smaller, but over
time cells are triggered further southwestward, as the gust front intersects
the preexisting boundary. This setup can lead to “back building.”
Back Building Definition:
Back building refers to the situation where new convection persistently
develops on the rear side of an existing storm or MCS. This may occur as
a result of inflow being lifted by an outflow boundary that has become nearly
stationary while the old cells move downstream or by gradual elimination
of the cap on the inflow side of the system. It can cause a storm or the
most vigorous parts of an MCS to propagate far to the right of the mean flow
or typical cell motion and often results in little movement of the region
of heaviest rain rates, producing flooding.
3.5.5 Review Question: Thunderstorm Formation
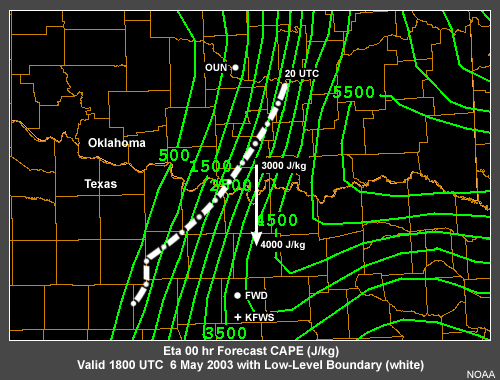
Assume it is mid-afternoon on 6 May 2003. Your job is to forecast thunderstorm
development for north-central Texas during the remainder of the afternoon
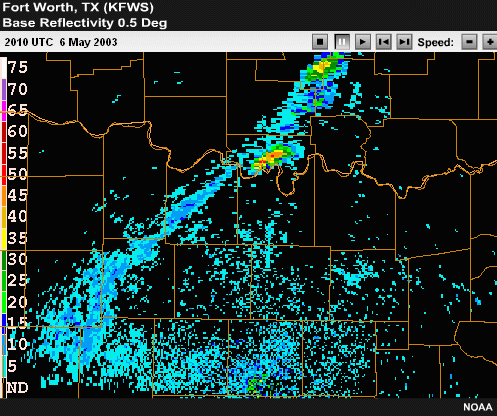
and early evening. At 2010 UTC low-level reflectivity data from the Fort
Worth radar (KFWS) indicate a northeast to southwest boundary from central
Oklahoma to the west of your area of concern.
To complete this exercise, study the radar loop and the accompanying data
products and circle the area(s) where you expect
storms to form in the next three to four hours. You will have the chance
to compare your prediction to the experts'.
Click the image above to view animation.

Review Question Feedback
Expert Answer:
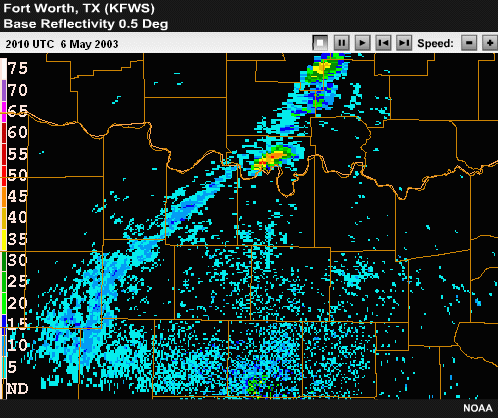
As shown in this radar loop, a line of thunderstorms did in fact back build
along the boundary to the southwest into north-central Texas during the late
afternoon and early evening.
Click the image above to view animation.
Expert Discussion:
This real life case closely matches the classic back-building
scenario depicted in the conceptual model below. Not only does the CAPE
increase to the south, but also there was evidence that the CIN (or cap)
was weaker to the southeast than the northwest. This was apparent in the
radar loop by noting that the thunderstorms initially developed over Oklahoma,
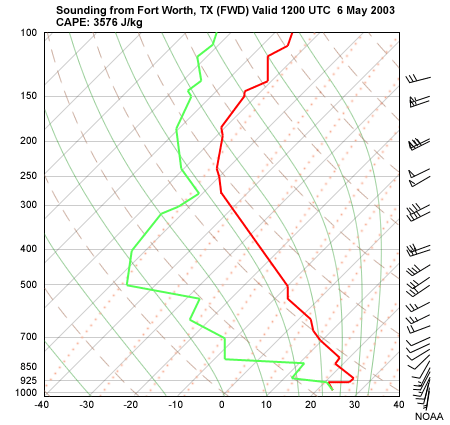
not in Texas. The morning wind profile shown in the soundings indicated
that the direction of mean vertical wind shear was toward the northeast.

End of Section 3.5: Squall Lines - Squall
Line Motion


