Conceptual Model
A 50 dBZ Echo Top Height is one of many signatures that points toward a severe thunderstorm. The presence of tall or elevated 50 dBZ echoes may indicate large hail. The ingredients needed for severe hail formation and growth include a strong, wide, persistent updraft in the hail growth layer (–10°C to –30°C). Once reflectivities reach values greater than 50 dBZ, it becomes increasingly likely that they represent hail. Large hail is among the likely severe convective hazards produced if this signature is positively identified.
Fig.1 shows that using the lowest PPI radar scan can make it difficult to find which core extends up into the hail growth layer.

Fig. 1: Lowest elevation scan on PPI and RHI showing thunderstorm 50 dBZ echo top height. White lines denote the top and bottom of the hail growth layer (–10°C to –30°C), as determined by a local sounding.
Fig. 2 shows that a CAPPI display set to the nomogram-derived 2cm hail threshold height quickly allows an operator to spot where a vertical cross section should be placed for the interrogation of the most significant cores.

Fig. 2: CAPPI cross–section on PPI of the same storm as previous figure, showing 50+ dBZ pixels "breaking through the CAPPI". White lines denote the top and bottom of the hail growth layer (–10°C to –30°C), as determined by a local sounding.
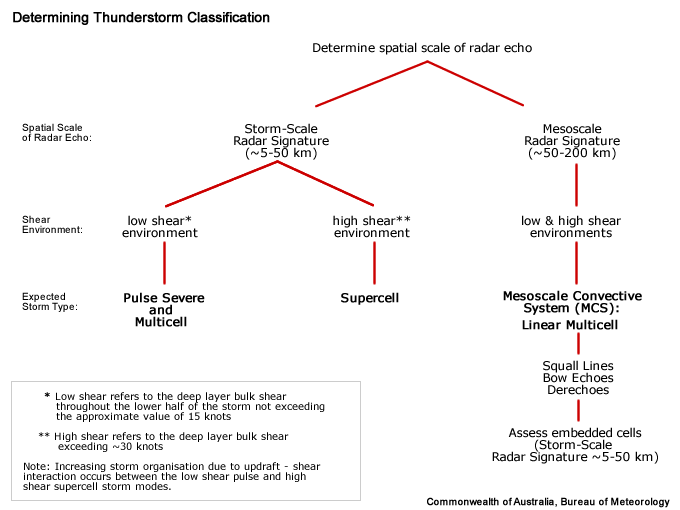
Determining Thunderstorm Classification
The 50 dBZ Echo Top Height signature can be found in supercells and multicells. A significant 50 dBZ echo top height requires a strong and reasonably sustained updraft, which can be found in pulse severe thunderstorms, supercells, and also in both the multicell modes.
To help determine the classification of the thunderstorm you are observing, use the following flow chart. Alternatively, if you already know the conceptual model, simply click on the appropriate model at the end of the flow chart.

